January 27, 2022
Timothy Aylor
Senior Economist
Economic Information & Analytics Division
timothy.aylor@vec.virginia.gov
(804) 786-3976
Virginia Job Openings and Labor Turnover – November 2021
~ The BLS Jobs Openings and Labor Turnover Survey released January 21st indicated continued tight, frenetic labor markets in the midst of the holiday season in Virginia ~
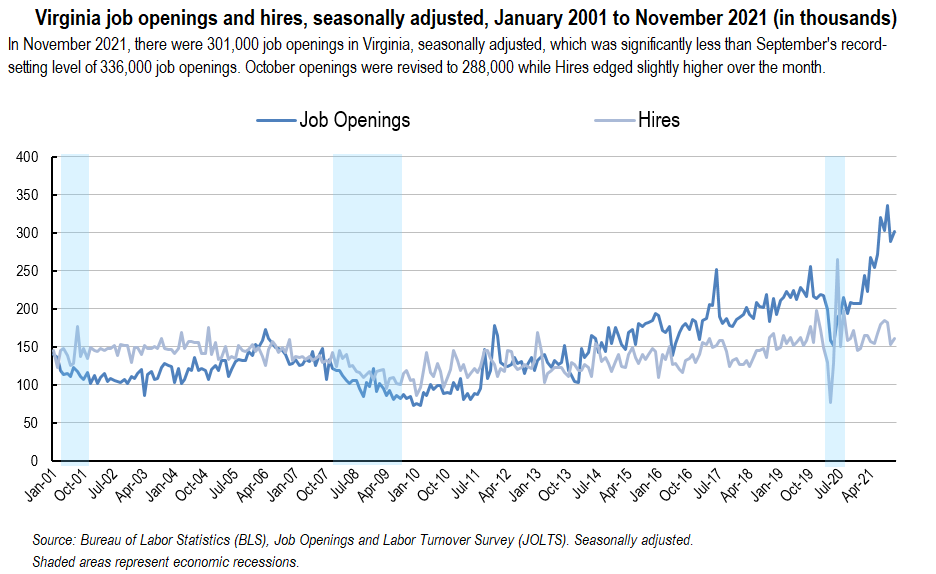
RICHMOND— According to the U.S. Bureau of Labor Statistics’ November 2021 Job Openings and Labor Turnover Survey (JOLTS), Virginia job openings remained at historically high levels as employers increased hiring but struggled to keep pace with historic levels of quitting that accelerated labor turnover rates.
JOLTS data provides information on all pieces that go into the net change in the number of jobs. These components include job openings, hires, layoffs, voluntary quits, and other job separations (which includes retirements and worker deaths). Putting those components together reveals the overall change in payroll employment. JOLTS data is seasonally adjusted and describe conditions on the last business day of the month. Current month’s data are preliminary and the prior month’s data have been revised.
The 13,000 increase in the number of job openings in Virginia to 301,000 was a small rebound from October’s revised figure but 35,000 lower than September’s record high. Nationwide, the number of job openings decreased to 10.6 million. They decreased in several industries with the largest decreases in accommodation and food services (-261,000); construction (-110,000); and nondurable goods manufacturing (-66,000).
The number of hires in Virginia rose by 8,000 to 161,000, in November; a rebound in hires from October’s drop but nearly six percent lower than November 2020. JOLTS defines hires as all additions to the payroll during the month. The series low of 77,000 was set in April 2020, while the high of 265,000 was set in June of last year. In November, the number and rate of U.S. hires were little changed at 6.7 million and 4.5 percent, respectively. The U.S. hires rate (hires as a percentage of total industry employment) in November varied by industry. The rate of manufacturing hires was relatively low but rose compared to November 2020. The hiring rate was most elevated in leisure and hospitality, professional and business services, and retail trade. Hiring rates also sped up in information and other services, compared to November 2020.
The number of quits in Virginia was little changed, increasing by only 1,000 to 106,000 from October but still 14% higher than November 2020. Quits, a component of total separations, are voluntary separations initiated by the employee. Across the U.S., the number of quits increased in November to a series high 4.5 million (+370,000). They increased in several industries with the largest increases in accommodation and food services (+159,000); health care and social assistance (+52,000); and transportation, warehousing, and utilities (+33,000). This represents the most people quitting since the United States began keeping records of the statistic about two decades ago and 37% higher than in November 2020. The number of quits can be seen as a leading indicator of wage trends in that it includes workers who quit to move to another job.
The job openings rate and the quits rate in the commonwealth remained elevated in November but both retreated from recent peak levels. The Virginia job openings rate (job openings as a percentage of total employment) was little-changed; rising by 0.2 of a percentage point to 7.0% in November. Nationwide in November, the job openings rate fell to 6.6 percent even though it remained highly elevated in accommodation and food service, transportation and warehousing, and healthcare. The November Virginia quits rate (the number of ‘quits’ as a percentage of total employment) was unchanged at 2.7% from October. The November quits rate nationwide increased to 3.0 percent, matching a series high last seen in September. Leisure and hospitality led in quits rate but, within that sector, accommodation and food service saw a much higher quits rate than art, entertainment, and recreation. Lower rates of quitting may continue in many white collar industries (information, financial activities, and government) as quit rates decreased in those industries over-the-year and compared to before the pandemic in February 2020.
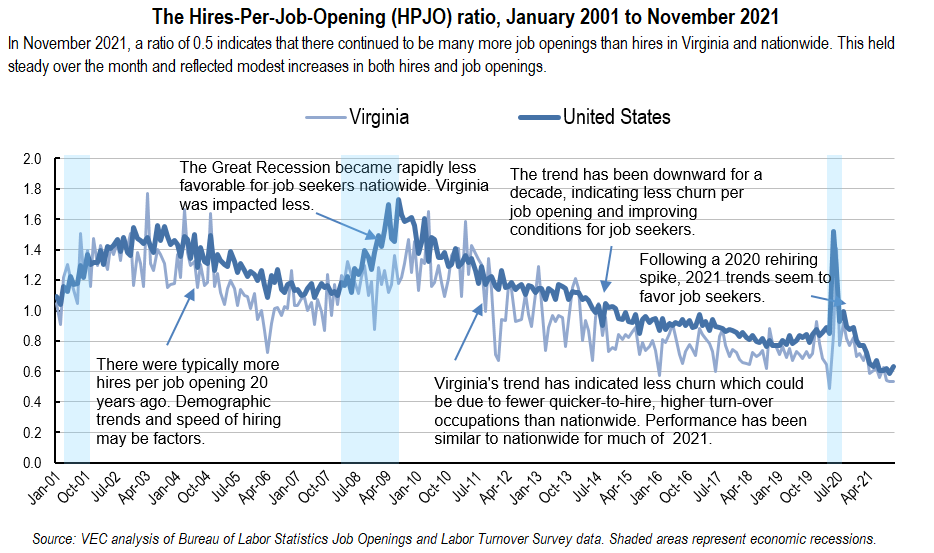
The hires-per-job-openings (HPJO) ratio was unchanged at 0.5 in November in Virginia and slightly higher at 0.6 nationwide. Virginia matched the series lows set in April 2020 and was driven by increases in both hires and job openings. This measure shows the rate of hiring compared to open jobs. It is a proxy for time to fill positions or the efficiency in filling open jobs in a labor market.
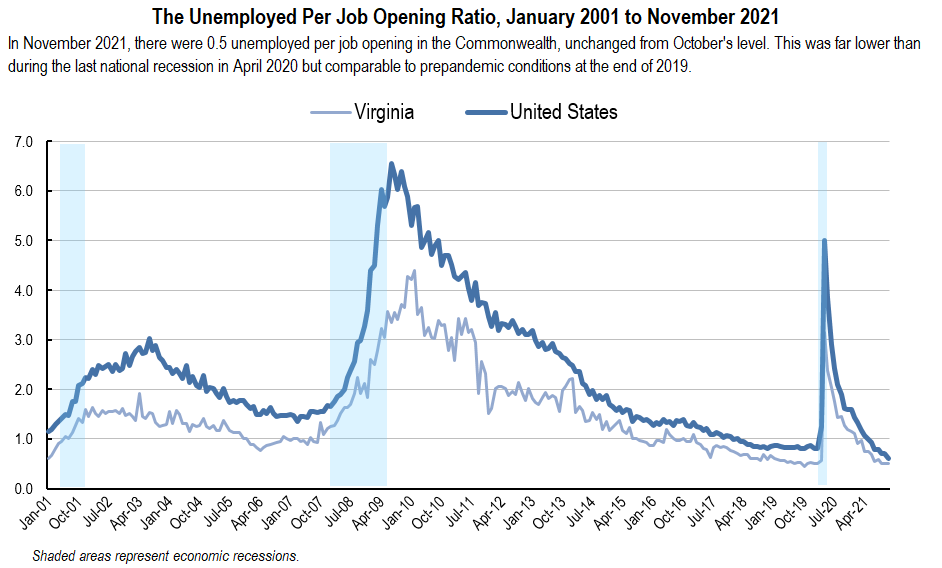
In November 2021, there was less than one (0.5) unemployed worker per job opening in the Commonwealth, unchanged over the month. This remained the lowest rate since February 2020, before the pandemic. In Virginia, the unemployed per job opening ratio (sometimes called the ‘job seekers ratio’) peaked at 4.4 unemployed per job opening in February 2010 during the Great Recession, while the number of unemployed workers per job opening stood at 3.1 in April 2020 during the height of pandemic employment impacts. Nationwide, there were roughly 64 unemployed workers for every 100 job openings in November, inching downward to the lowest ratio of unemployed-to-openings on record.
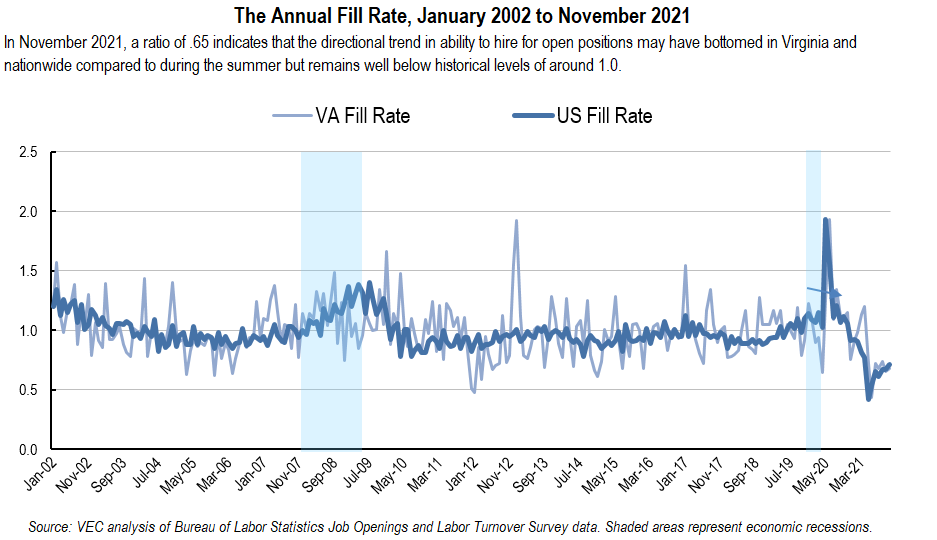
In November 2021, the ‘annual fill rate’ (the ratio of hires to job openings over the year) remained at 0.7 where it had been since that June. This indicates that, during the summer and fall in Virginia, it was more difficult to fill positions compared to the same period in 2020. The fill rate is a measure used to evaluate how labor markets differ in the pace that job openings are filled. An annual fill rate near or above 1.0 can indicate that employers are more efficient at filling job openings over the year. On the other hand, an annual fill rate of less than 1.0 can indicate a tighter labor market, with employers having difficulties filling job openings.
Since 2001, the highest annual fill rate occurred during June 2020 because, after the nationwide shutdown due to the COVID-19 pandemic, employers across the country sought to quickly fill vacated positions. There were many factors that hindered the filling of vacant positions by employers, such as health concerns, employee skills, childcare needs, and industry characteristics. The lowest fill rate in Virginia occurred in May 2021.
The number of layoffs and discharges in Virginia was little changed at 29,000 in November. This was a reduction of 90% from the pandemic high set in March 2020 and 40% lower than in November 2020. Layoffs and discharges are involuntary separations initiated by the employer. Layoffs and discharges are countercyclical, which means that layoffs typically increase during economic contractions and decrease during economic expansions. In November, the number of U.S. layoffs and discharges was little changed at 1.4 million. While nearly all sectors experienced lower layoffs over the year, the arts, entertainment, and recreation industry had the highest layoff rate and worsened compared to November 2020.
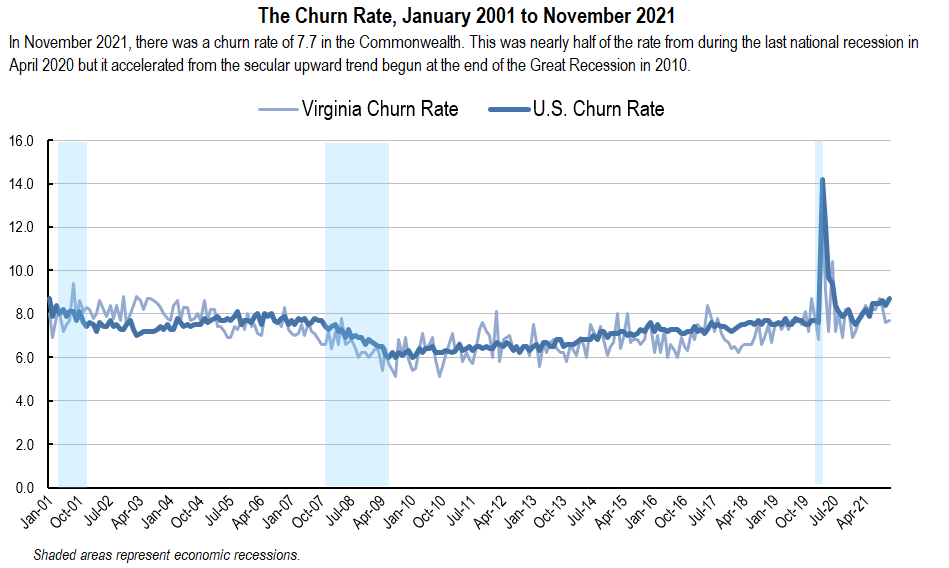
The November 2021 ‘churn rate’ (the sum of the state hires rate and the total state separations rate) of 7.7 in Virginia indicated significant deceleration from the spring and summer’s frenetic pace of labor market turnover. There was no similar slowing down in churn nationwide as it rose (aside from extraordinary spike during the pandemic) to a new record level. An elevated churn rate indicates a labor market with a high hires rate, a high separations rate, or both. It can signify that workers are moving more frequently into and out of jobs in the labor market. Conversely, a low churn rate indicates a labor market with a low hires rate, a low separations rate, or both. Labor markets with the most churn may have more seasonal employment patterns not fully captured by seasonal adjustment factors, which can lead to more frequent job-to-job movement.
As the 2021 holiday season began in November, most measures of Virginia job openings and labor turnover indicated continued tightness, reversing some of October’s slight slowdown. Indicators made clear what a job seekers market it was as the rate of hires to job openings fell to a record low in November. Nationwide, the number of quits and the quits rate reached record highs. This was prevalent in the leisure and hospitality industry, especially accommodations and food service, where the rate of hiring still exceeded the historically high rate of quitting. During a period of pandemic fatigue and uncertainty, this accelerated velocity of labor turnover indicates that, while some workers left the labor force entirely, more remained in their industries but shuttled between employers, looking for better working conditions and higher pay.
The Virginia Employment Commission plans to release the December 2021 analysis of the BLS Job Openings and Labor Turnover Survey for Virginia on Tuesday, February 22, 2022. The data for all states and the U.S. will be available on the BLS website JOLTS page, at https://www.bls.gov/jlt/. BLS is scheduled to release the JOLTS data for states on Thursday, February 17, 2021.
Technical note: The Bureau of Labor Statistics (BLS) Job Openings and Labor Turnover Survey (JOLTS) produces monthly data on U.S. and regional job openings, hires, quits, layoffs and discharges, and other separations from a sample of approximately 21,000 establishments. As a supplement, BLS has begun publishing state estimates that provide monthly information that can be used to better understand the dynamic activity of businesses in state economies that leads to aggregate employment changes. For more information on the program’s concepts and methodology, see “Job Openings and Labor Turnover Survey: Handbook of Methods (Washington, DC: U.S. Bureau of Labor Statistics, July 13, 2020), https://www.bls.gov/opub/hom/jlt/home.htm. For more information on BLS’ state JOLTS estimates, see https://www.bls.gov/jlt/jlt_statedata.htm.
Definitions of JOLTS terms*
Job Openings
Job openings include all positions that are open on the last business day of the reference month. A job is open only if it meets the following three conditions: (1) A specific position exists and there is work available for that position; the position can be full time or part time, and it can be permanent, short term, or seasonal; (2) the job could start within 30 days, whether or not the employer can find a suitable candidate during that time; and (3) the employer is actively recruiting workers from outside the establishment to fill the position. Excluded are positions open only to internal transfers, promotions or demotions, or recalls from layoffs.
Hires
Hires include all additions to the payroll during the entire reference month, including newly hired and rehired employees; full-time and part-time employees; permanent, short-term, and seasonal employees; employees who were recalled to a job at the location following a layoff (formal suspension from pay status) lasting more than 7 days; on-call or intermittent employees who returned to work after having been formally separated; workers who were hired and separated during the month; and transfers from other locations. Excluded are transfers or promotions within the reporting location, employees returning from a strike, and employees of temporary help agencies, employee leasing companies, outside contractors, or consultants.
Separations
Separations include all separations from the payroll during the entire reference month and are reported by type of separation: quits, layoffs and discharges, and other separations. Quits include employees who left voluntarily, except for retirements or transfers to other locations. Layoffs and discharges include involuntary separations initiated by the employer, including layoffs with no intent to rehire; layoffs (formal suspensions from pay status) lasting or expected to last more than 7 days; discharges resulting from mergers, downsizing, or closings; firings or other discharges for cause; terminations of permanent or short-term employees; and terminations of seasonal employees (whether or not they are expected to return the next season). Other separations include retirements, transfers to other locations, separations due to employee disability, and deaths. Excluded are transfers within the same location, employees on strike, and employees of temporary help agencies, employee leasing companies, outside contractors, or consultants.
*Excerpted from U.S. Bureau of Labor Statistics, Handbook of Methods, "Job Openings and Labor Turnover Survey: Concepts," https://www.bls.gov/opub/hom/jlt/concepts.htm.